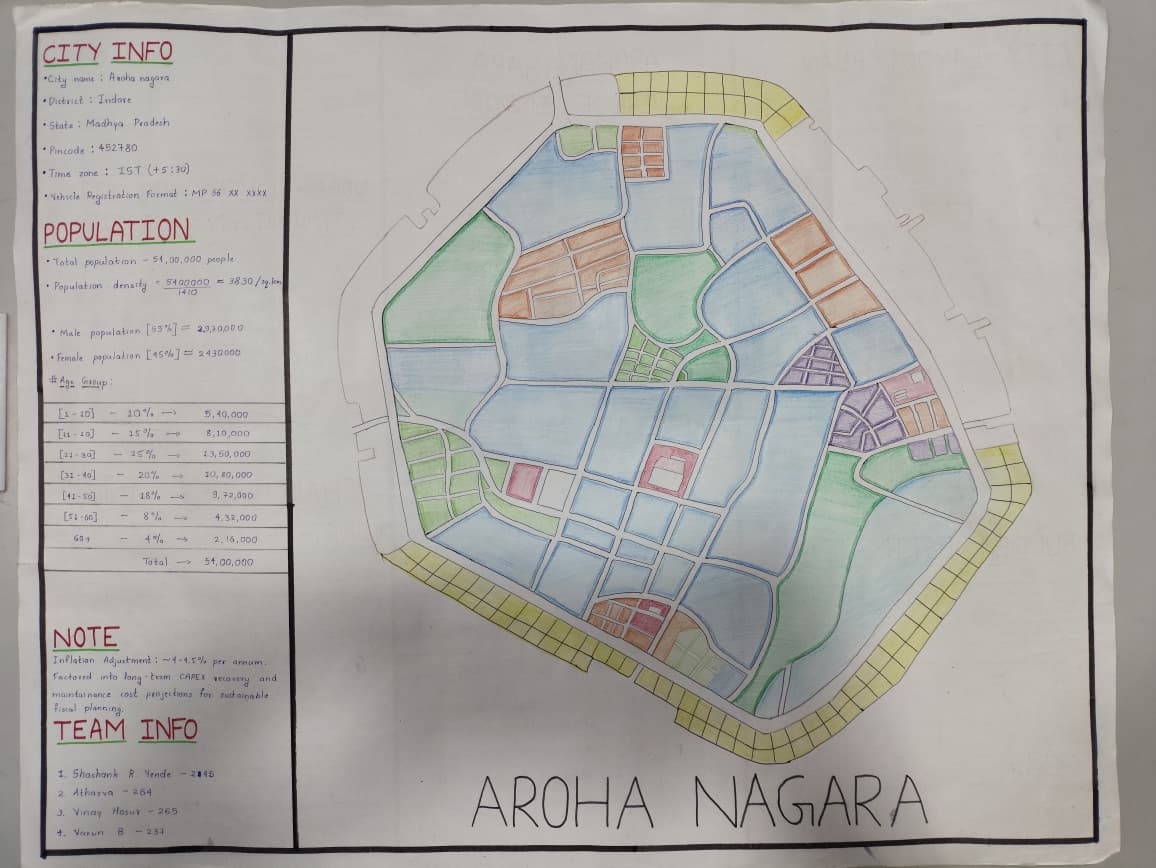
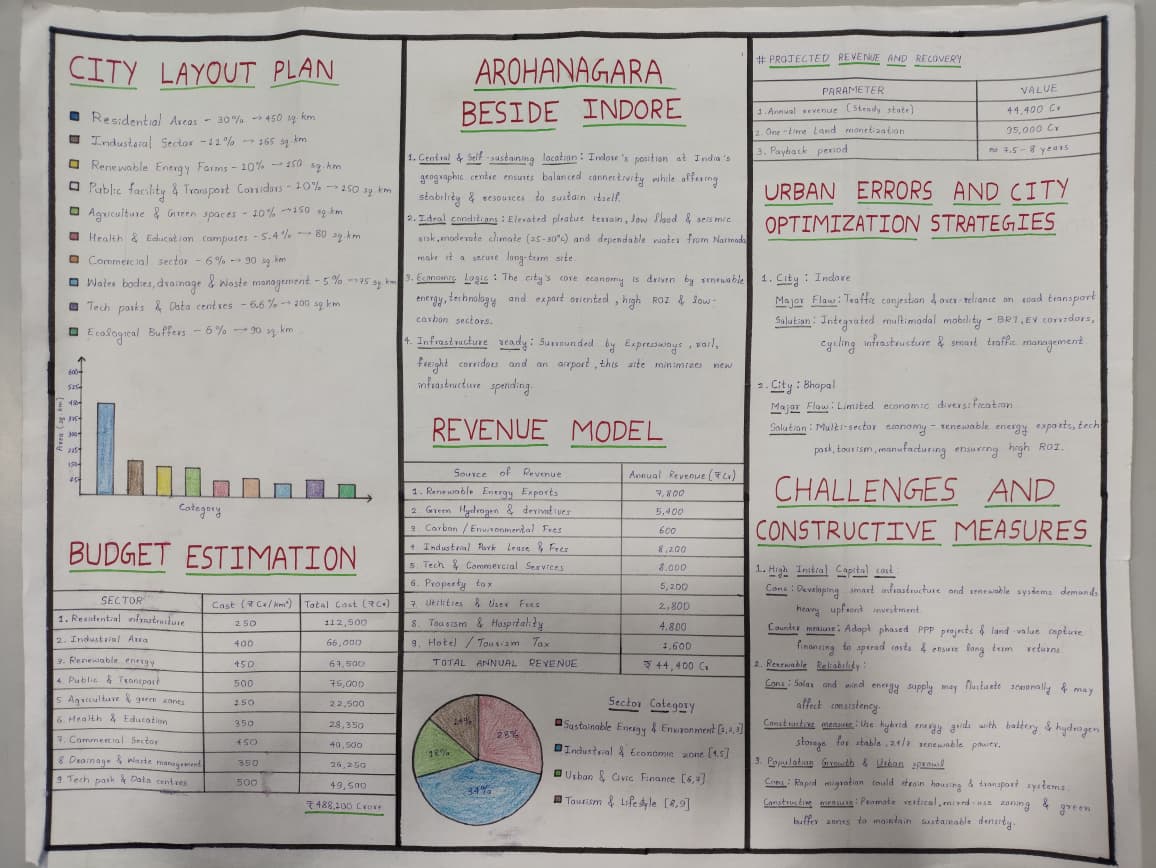
City Layout Plan
A balanced distribution of residential, commercial, industrial, and environmental zones to promote sustainable urban growth.
A Data Structures & Algorithms Based Smart City Model
The “Arohanagara” project explores how data structures and algorithms can support the design of a modern, sustainable smart city. Rather than treating DAA as purely theoretical, we analysed how graph theory, pathfinding, pattern searching, and hierarchical structures influence real-world decisions.
Through the semester, we realised that city planning is essentially a data problem. Roads resemble weighted graphs, zoning behaves like tree structures, and resource distribution depends heavily on efficient searching and optimization methods.
Our model demonstrates how algorithmic thinking improves urban design—optimizing routes, predicting hazards, allocating resources, and reducing costs. Arohanagara represents the practical translation of classroom concepts into real-world planning.
A balanced distribution of residential, commercial, industrial, and environmental zones to promote sustainable urban growth.
| Sector | Cost (₹ Cr / km) | Total Cost (₹ Cr) |
|---|---|---|
| Residential Infrastructure | 250 | 112,500 |
| Industrial Area | 400 | 66,000 |
| Renewable Energy | 450 | 67,500 |
| Public & Transport | 500 | 75,000 |
| Agriculture & Green Zones | 150 | 22,500 |
| Health & Education | 350 | 28,350 |
| Commercial Sector | 450 | 40,500 |
| Waste Management | 350 | 26,250 |
| Tech Park & Data Centres | 500 | 49,500 |
| Total | 4,88,100 |
| Source | Annual Revenue (₹ Crore) |
|---|---|
| Renewable Energy Exports | 7,800 |
| Green Hydrogen | 5,400 |
| Environmental Fees | 600 |
| Industrial Leases | 8,200 |
| Tech Services | 8,000 |
| Property Tax | 5,200 |
| Utilities | 2,800 |
| Tourism | 4,800 |
| Hotel Tax | 1,600 |
| Total Annual Revenue | 44,400 |
Optimizing traffic flow and route planning using Graph Theory (Dijkstra's, A*) and max-flow algorithms.
Managing power grid distribution and load balancing using Greedy Algorithms and Minimum Spanning Trees (Prim's).
Optimizing land use, zoning allocation, and facility location using Dynamic Programming and spatial data structures.
Sustainability-focused systems designed using graphs, trees, greedy heuristics, clustering and pattern matching — mapped from theory to real-world, city-scale problems.